Market basket analysis in retail
Today, leading companies are applying advanced predictive modeling to their vast and growing amounts of data to improve business performance via faster, better decision making. Using predictive analytics for customer analytics and marketing analytics allows organizations to discover valuable insights and intelligence from their data—in doing so they uncover new opportunities to increase sales and profitability.
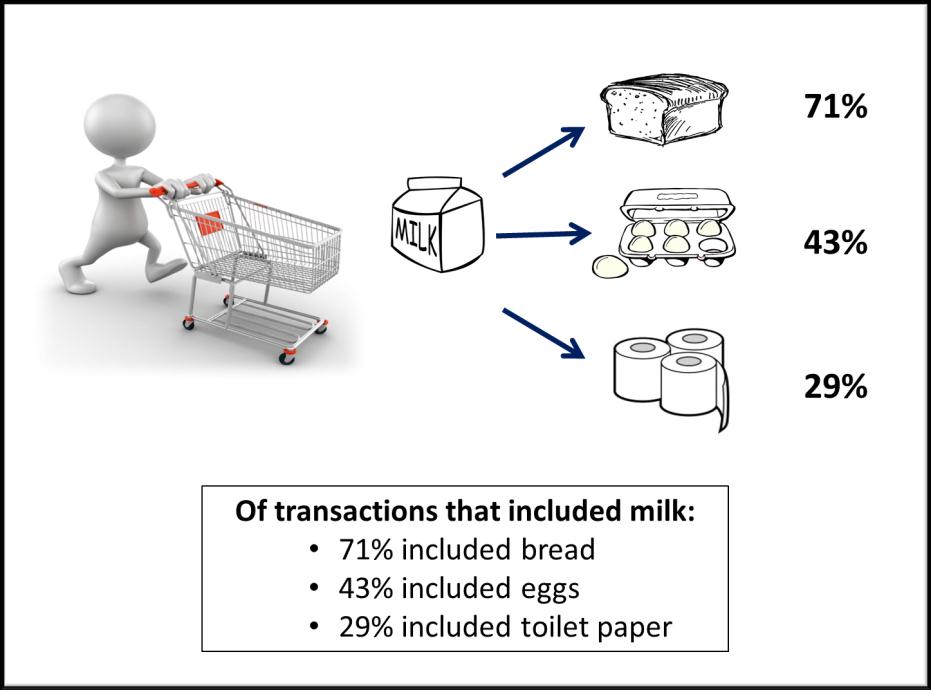
In retail, marketing, banking and medical services, affinity analysis and association rule learning have become an important aspect in making the right decisions and conclusions. These analysis embraces a broad set of analytics techniques aimed at uncovering the associations and connections between specific objects, e.g., visitors of a website, products in a store, content items of media site, etc. One of these techniques, i.e., market basket analysis, checks whether there are combinations of products that frequently co-occur in transactions. For example, people that buy flour and casting sugar, also tend to buy eggs (because a high proportion of them are planning on baking a cake).
For retailers , these insights are important for several reasons:
Put products that co-occur together close to one another, to improve the customer shopping experience and gain gain profit.
Target customers who buy flour with offers on eggs, to encourage them to spend more on their shopping basket.
The Process
To apply and understand the methodology around market basket analysis (MBA), some knowledge of mathematics, probability theory and statistics needs to be present.
Let I denote the set of items, which are objects that we are identifying associations between. In retail, these items can be seen as products in the shop, e.g., eggs correspond to the first item (i1), fruit to the second item (i2), etc. Every retailer (e.g., Delhaize, Colruyt, etc.) therefore encompassess a set of products (items) in their shop, which can mathematically be denoted by
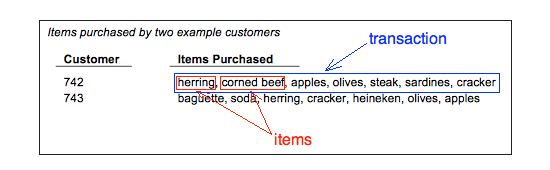
Furthermore, we define Tn as the set of items co-occuring together in transaction n. For a retailer, a transaction is, generally, a transaction. For a publisher, a transaction might be the group of articles read in a single visit to the website (it is up to the analyst to define over what period to measure a transaction). Mathematically, we can write Tn as
Given these information in a dataset, MBA returns a set of association rules in the form of
i.e., if you have the items in item set (on the left hand side (LHS) of the rule i.e. {i_1, i_2,...}), then it is likely that a visitor will be interested in the item on the right hand side (RHS i.e., {i_k}). In case of our example above, the rule results in
MBA analysis often produces very large numbers of rules, especially when many items are involved.There is no single-best way to decide which rules are the “interesting” rules. Many approaches have been suggested and investigated, including some of the most widely reported MBA metrics. In what follows, we will discuss 4 popular measurements.
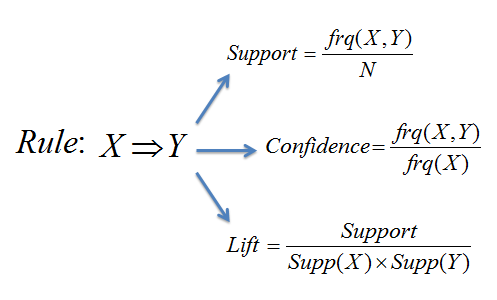
To explain these measurements more in detail, lets consider the rule X => Y.
The joint probability that both items are in a basket. It answers the question what percent of baskets contain X and Y?
The conditional probability that Y is in the basket given that X is present.
The probability that Y is in a basket.
The confidence divided by the expected confidence. It’s the ratio of the likelihood of Y being in a basket with X to the likelihood of Y being in any basket.
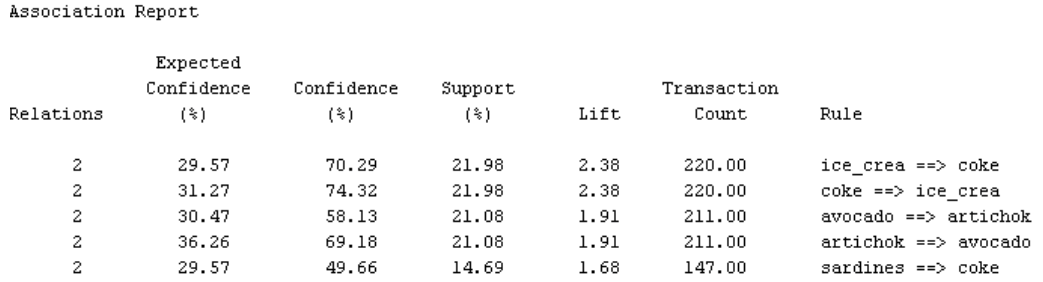
For simplicity, we clarify these measurements by an example. Suppose MBA outputs the rule {ice cream} => {coca cola} with a support of 21.98% and a confidence of 70.29%. Generally, it means that in 21.98% of the cases ice cream and coca cola products are sold together, and in 70.29% of the case when someone purchases an ice cream product, a coca cola product is also purchased.
But which are the best rules? Traditionally, support and confidence have been used to identify important rules, but “the most popular objective measure of interestingness is lift”. When lift is greater than 1, X is said to “lift” the presence of Y above what we would expect to see. But can we be sure that the rules, even the rules with lift > 1, are statistically significant? One experimental study showed even with minimum support and confidence constraints in place, up to 30% of the generated rules were statistically insignificant (Dorn et al., 2008). Adding a significance test for each rule would provide an additional criterion for judging rule importance. A test can also be used to prune rules with lift > 1 by setting aside those that are not statistically significant.
For these reasons, a chi-square test for independence can be used. It evaluates the null hypothesis that the presence or absence of Y is not related to the presence or absence of X. The test is based upon a 2 x 2 contingency table comprised of the cross-tab frequencies of X and Y, where the test statistic is formulated as
Note that chi-square results are unreliable when cell counts are less than 5. Setting an appropriate minimum support can help mitigate this occurrence.
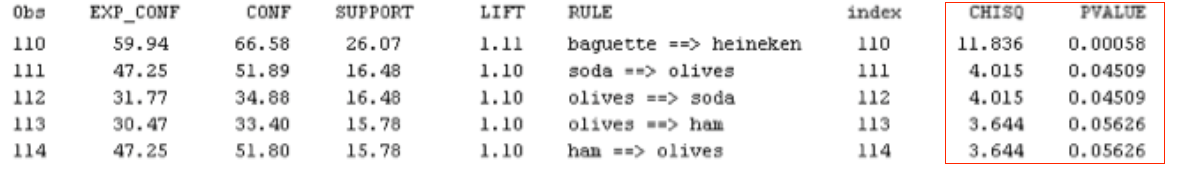
Going back to our example, we for example see that rules 113 and 114 have lift > 1, but are not statistically significant at alpha = .05.
In the past, i have conducted these analysis for a Belgium food company, in order to assist marketeers and retailers in making the right choices. The main goal of this project was to check whether improvement could still be made with the use of advanced analytics. After applying MBA and making recommendations to the personnel of the company, a profit of 7% was gained after 5 months. Analysis were performed with SAS, where a SAS macro was used to obtain the results.